“Quite high.” That is how Fed chair Janet Yellen described stock valuations last week. Cue the usual Fed rate hike speculation. One camp thinks a hike is overdue—that the Fed has been too accommodating, inflating asset bubbles across the land. Others fret a hike and argue the US economy needs continued “Fed support.” So who is right?
By Fisher Investments Editorial Staff, 15/05/2015
Neither! In our view, Fed monetary policy has neither overinflated investible assets like stocks, nor has it artificially propped up the bull. This debate shows skepticism and fears are alive and well—bullish for stocks.
Some pundits claim low interest rates and other policies like quantitative easing (QE) have driven investors to forsake low-yielding assets and pile into higher-yielding, “riskier” securities (e.g., corporate and junk bonds and stocks)—inflating prices. While we’re sure this has happened in individual cases, as a broad thesis, there are big holes. First, evidence suggests Fed policy has actually been more “tight” than “loose.” Traditionally, when the Fed has sought to boost liquidity, it has kept the discount rate below the fed-funds rate, allowing banks to borrow directly from the Fed cheap and profit by lending at the higher fed-funds rates—the profit is an incentive to pump cash. Today’s Fed has held the discount rate above fed-funds throughout the bull—suggesting policy wasn’t easy. As for QE, if it were truly a weapon of mass stimulation, why was loan growth anemic while it ran? QE’s long-term bond buying lowered long rates and flattened the yield curve—discouraging banks from lending, as loan profitability relies on low short-term rates (banks’ funding costs) and higher long-term rates (interest revenue).
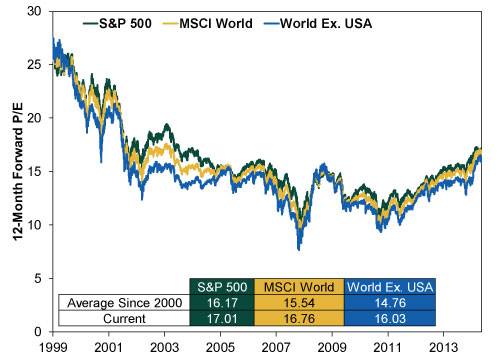
Data also show bubble worries are overwrought. In a frothy environment, valuations should be stratospheric—but they aren’t. They are modestly above average, suggesting optimism, but far from bubble-like 2000 levels. (Exhibit 1)
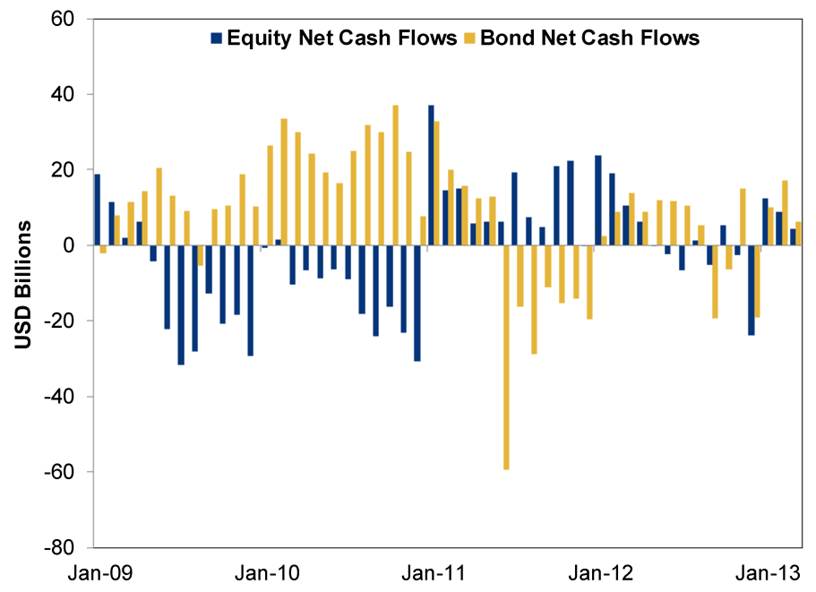
Fund flows—another sign of sentiment—don’t suggest investors have switched en masse from bonds to stocks, either. (Exhibit 2)
Exhibit 2: Monthly Net New Cash Flows for Equity and Bond Mutual Funds
Source: Investment Company Institute, as of 5/14/2015. From 1/31/2009 – 3/31/2015.
Equity inflows have trailed bond inflows throughout this bull market. Since March 2009, equity mutual funds have had a cumulative outflow of $82.5 billion, while bond mutual funds have had a cumulative inflow of $1 trillion.[i] While these data don’t include Exchange-Traded Funds, which do show higher equity inflows, even if you add in ETF fund flows, bonds still outpace stocks overall. Little suggests folks are discarding fixed income for equities.
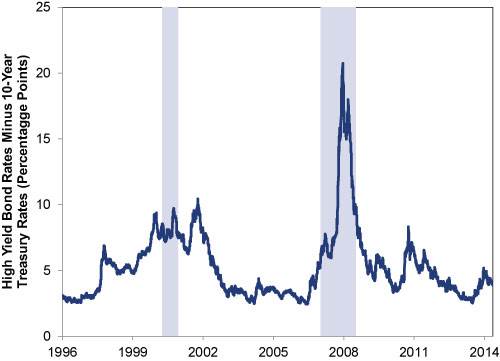
As for high-yield bonds, while yields are low by historical standards, they aren’t historically low when compared to Treasury rates—a better gauge of investors’ risk perception. Credit spreads were lower in the mid-1990s and during much of the 2002-2007 bull market. (Exhibit 3)
Exhibit 3: US High-Yield Bond Spread Over 10-Year Treasurys
Source: St. Louis Federal Reserve, as of 5/14/2015. Bank of America Merrill Lynch US High Yield Master II Effective Yield Minus 10-Year Treasury Constant Maturity Rate, from 12/31/1996 – 5/12/2015. Shaded areas represent US recessions, as defined by the National Bureau of Economic Research.
There just aren’t signs many folks are acting out of pure greed today. With pundits continuously warning about bubbles rather than heralding the arrival of a new perma-positive economy, a greed free-for-all[ii] doesn’t seem close.
On the other end of the spectrum, others believe the Fed should maintain its accommodative monetary policy until “normalcy” returns. But show us the evidence the US economy is actually weak.[iii] It has been growing for nearly six years, consumer spending is up, private businesses keep expanding, and outside Energy’s well-known woes, corporate earnings and revenues remain robust. It also looks likely to keep growing—The Conference Board’s Leading Economic Index (LEI) is up 14 straight months, and since its published history begins in 1959, no recession has started while LEI was rising. So we fail to see how an initial rate hike—one coming off near zero—is going to squash growth. Not only that, there isn’t any evidence a fed-funds rate hike is even a negative for markets. What happens to the yield curve is more important, as it impacts loan profitability and, hence, banks’ willingness to lend. One rate hike today, unless it is massive, won’t invert the yield curve.
In our view, today’s market has all the hallmarks of a typical bull. By “typical,” we aren’t saying it will play out exactly as past ones did, but history suggests stocks’ rise shouldn’t surprise. Since 1932, bull markets have had an average annualized return of 21%, with a high of 36% and a low of 14%.[iv] Through May 14, the S&P 500 is annualizing 23% in this bull—middle of the road for a bull market.[v] Despite the many concerns the bull isn’t reflecting economic reality, stocks are behaving as they always have—the ultimate forward-looking gauge. The current bull started in March 2009, three months before the recession ended[vi] and eight months before the unemployment rate[vii] started falling.[viii] This is similar to the 1990s: The bull was born in October 1990, economic expansion started in April 1991 and the unemployment rate didn’t begin falling until July 1992. The 1982-1987 bull began in August 1982, yet the economy and jobs didn’t stop falling until December 1982 and January 1983, respectively. Back then, folks bemoaned part-time work and low pay, coining the term “McJobs” in 1986. In the two bull markets of the 1970s (1970-1973 and 1974-1980), the economy and unemployment also both lagged stocks.
This bull market’s false fears really aren’t so different from past ones, either. Pundits fretted government gridlock in 1994 just as they have since 2011. Concerns about low oil prices existed in 1998. Former Fed head Alan Greenspan openly pondered whether stocks were bubblicious in December 1996, similar to Yellen’s musings. Geopolitical worries were just as acute in the past as they are today. False Fed hike fears are a bull market regularity. Investors today just don’t appreciate the bright reality around them—typical bull market sentiment!
So no, folks, we aren’t seeing an economy or market manipulated by those on Constitution Ave. What we see today is a normal, maturing bull market. As with any bull market, we may see some short-term pullbacks or even a correction—markets can be volatile. But this typical bull looks likely to keep charging ahead, in our view. Skepticism remains, masking a brighter reality, and that (as usual) is behind the bull. Not the Fed.
[i] Source: Investment Company Institute, as of 5/14/2015.
[iii] And no, Q1 growth at a 0.2% seasonally adjusted annual rate isn’t evidence. See here for why.
[iv] Source: FactSet, as of 3/18/2015. Annualized S&P 500 price level returns for bull markets from 6/1/1932 – 12/31/2008.
[v] Ibid. Note: The current cycle is incomplete and uses data from its start (3/9/2009) through 5/14/2015.
[vi] Source: The National Bureau of Economic Research.
[vii] It is worth mentioning private payrolls kept falling until February 2010, highlighting a statistical quirk—and limitation—of the unemployment rate. Folks leaving the labor force could stabilize the unemployment rate—even if payrolls are still dropping.